Tag: data visualization
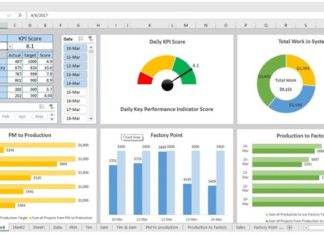
What is Excel Pivot? A Guide to Using Pivot Tables in Excel
Pivot Excel is an indispensable feature within Microsoft Excel that empowers users to create insightful reports with user-friendly tables and functions. It streamlines the reporting process, enabling you to effortlessly analyze and summarize large datasets to make informed decisions. Harness the potential of Pivot Excel today to elevate your reporting capabilities.
How to Insert Images into Google Sheets for a More Visual and Appealing Spreadsheet
Inserting images into Google Sheets allows you to not only visually enhance your spreadsheets but also convey information in an easy and clear way. Whether you're a project manager or a freelancer, anyone can take advantage of this feature.
10 Free Tools for Designing Intuitive and Eye-Catching Infographics
Do you want your data to stand out? Infographics are the way to go! This article will show you 10 free tools that can help you create impressive Infographics efficiently. Learn how to create beautiful visuals with these easy-to-use tools.


